A Brief History of Buy & Hold
“The stock market is a device for transferring money from the impatient to the patient”
– Warren Buffet
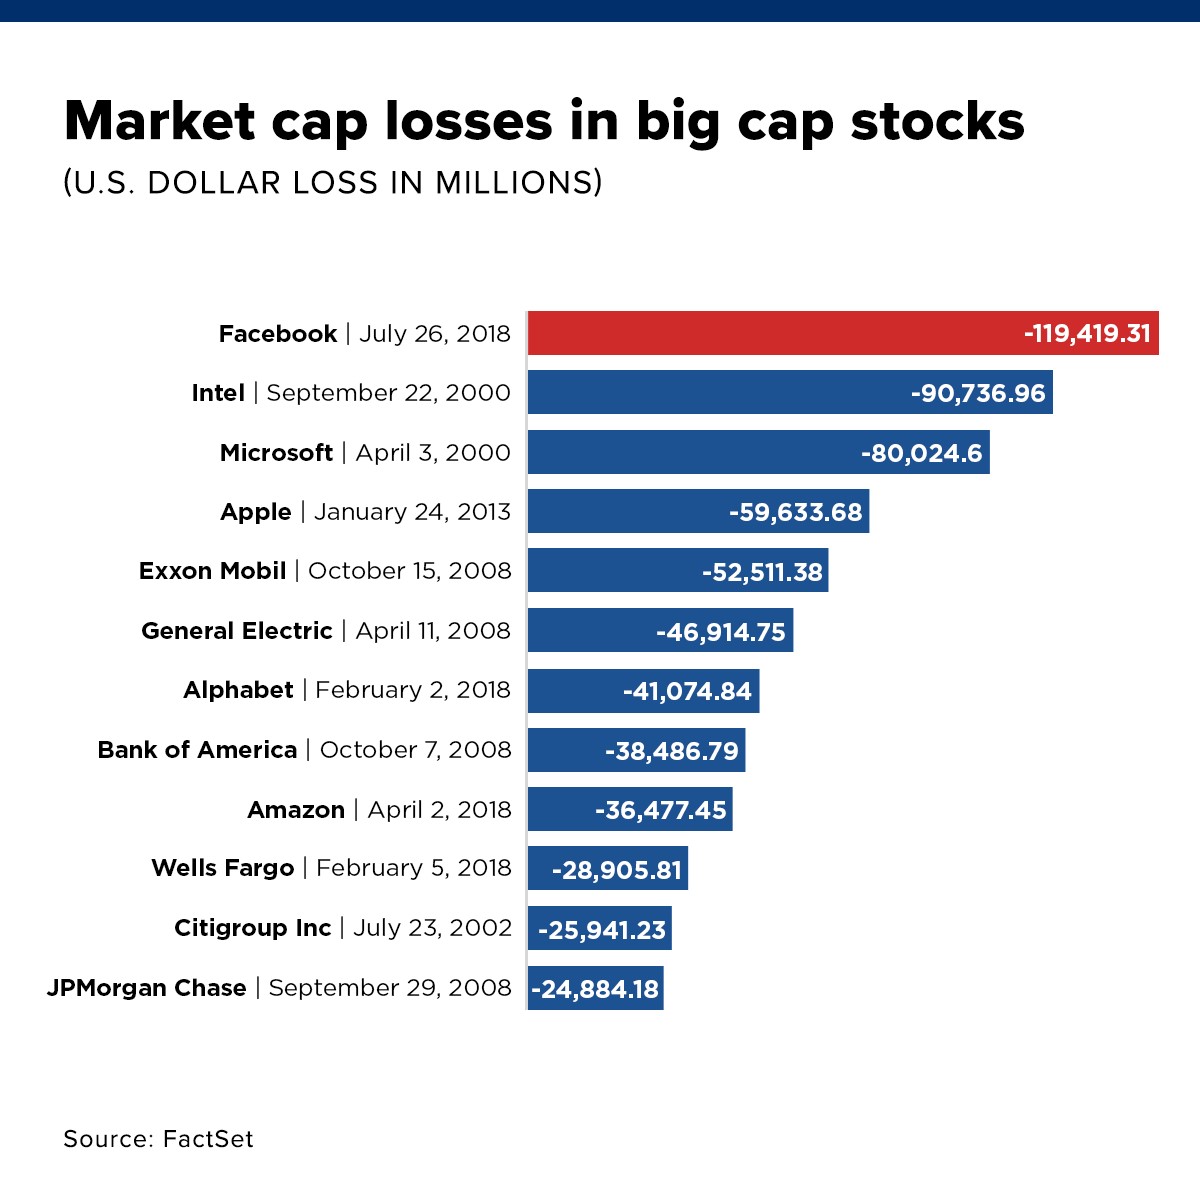
On July 26, Facebook posted the largest one-day decline in US stock market history, as their shares declined by 19% and the market capitalization of the company dropped by $119 Billion. Facebook shareholders were shocked by the magnitude of the meltdown or “Faceplant” after their recent earnings call. While we won’t go into the minutia of the reasons for the selloff, or our opinion on the future outlook for the company, we do want to provide some historical perspective on large one day selloffs, annual volatility, and what to do in the face of it.
The below information from FactSet shows some of the largest one day losses ever for large cap companies. As you can see, there are several familiar names on this list – Apple, Microsoft, and Amazon in particular. So while Facebook’s Hindenburg-esque drop was the largest, it was not entirely unprecedented.

NOTED: These are just one day snapshots. We thought it would be more relevant to look back at the annual selloffs of these market leaders. Below is a chart of Apple, Amazon, and Microsoft which illustrates their annual high and low share price for every calendar year dating back to 2007. It also shows the percentage (loss) from the prior year’s highest share price to the next year’s lowest price. * The last data point, Current Value, which is highlighted in green shows the price as of the close of trading on 7/31/2018. Highlighted in yellow are the worst peak to trough trading periods (excluding 2008-2009) these companies have experienced over the last decade.

As you can see from the above chart, the year to year swings is what causes Warren Buffet’s “device” to exist in the first place. Looking in the rearview mirror, shareholders of AAPL, AMZN and MSFT would be kicking themselves if they were sellers during these “short term” year to year selloffs. Since 2007, Microsoft has an average annual return of 18.13%. Apple’s average annual return is 25.13%, and Amazon’s average annual return has been 36.97%. Amazon, Apple and Microsoft are great examples of where the “buy and hold” strategy has benefited shareholders.
Let’s take a closer look at the broader market. As we have stated in prior communications, the S&P 500 index, since 1980, has had an average annual intra-year decline of almost 14%. Investors in the S&P 500 that “road out the storms” over the past 4 decades though, were rewarded with an 11% average annual return. We are writing this blog to remind investors that great companies as well as the broad market are going to stumble from time to time and unfortunately their growth patterns are not linear. Our behavior during these-peak-to-trough periods will by and large dictate our long-term investing success. Simply stated, investing is won in decades, not days or months!
As always, if there is anything we can do for you, please give us a call at 208.331.7858. Have a great day!
This material is intended for informational/educational purposes only and should not be construed as investment advice, a solicitation, or a recommendation to buy or sell any security or investment product. Please contact your financial professional for more information specific to your situation. * Adjusted for Splits. Source: ValueLine 2018.
Investments are subject to risk, including the loss of principal. Because investment return and principal value fluctuate, shares may be worth more or less than their original value. Some investments are not suitable for all investors, and there is no guarantee that any investing goal will be met. Talk to your financial advisor before making any investing decisions.
All indices are unmanaged and investors cannot actually invest directly into an index. Unlike investments, indices do not incur management fees, charges, or expenses. Past performance does not guarantee future results.
Securities and advisory services offered through Commonwealth Financial Network®. Member FINRA, SIPC, a Registered Investment Adviser.