A Note on Volatility
Last week the Dow Jones index (DJIA) and the S&P 500 (S&P) index saw their worst weekly declines in over 2 years. The DJIA fell 4.1%, and the S&P fell 3.9% on the week. Why did this happen? Will it continue? What to do about it? These are all questions we have been getting from clients and friends over the last week or so. Below is a short primer that hopefully can answer some questions and alleviate some long term concerns you may have.
First, some historical perspective on volatility…
According to Websters, volatility is “a tendency to change quickly and unpredictably.” Although volatility is normally associated with things, or in this case, prices, going down, volatility can also mean they are going up as well.
Going back to 1980, the average intra-year decline in the S&P 500 is approximately 14%. This means each and every year, on average, the S&P 500 index, at some point, falls 14% from peak to trough. Below is a chart from JP Morgan’s quarterly Guide to the Markets showing the intra-year declines vs. the overall return for each year. The grey bars represent the % return for the year, and the red numbers represent the intra-year declines. (The data is only through the end of January.)
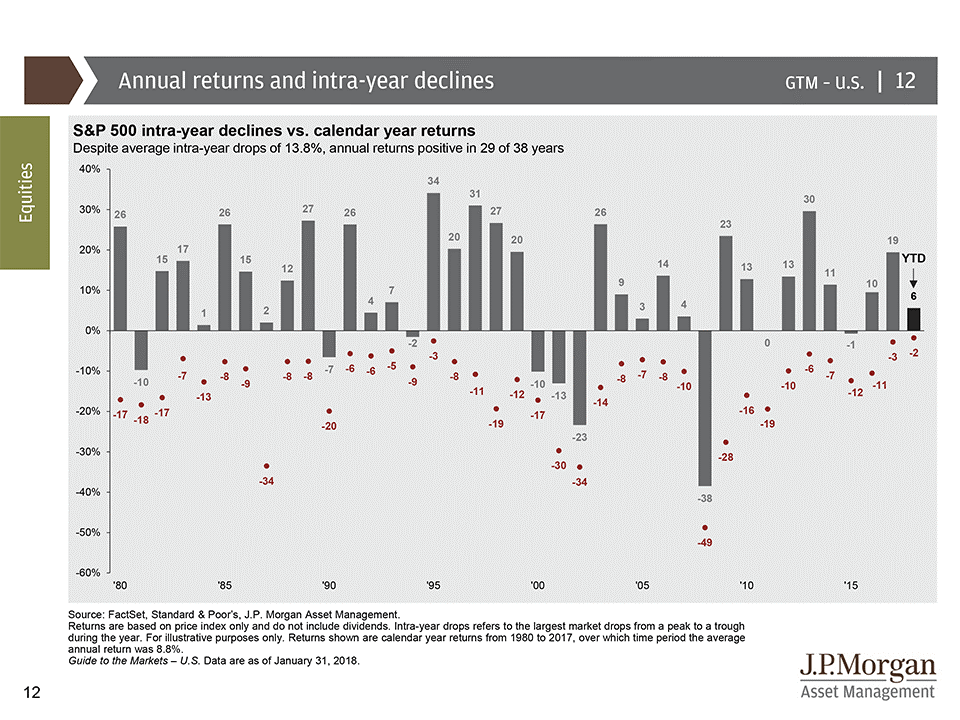
As you can see, in 2016, the largest intra-year decline was 11%. If you remember, this happened at the very beginning of the year. Then in 2017, the largest decline was only 3%. So in reality, we have seen almost no volatility in the equity markets since February of 2016. Not historically unprecedented, but close.
So, what can we conclude from the above? If nothing else, all other things being equal, we were due for more normalized volatility this year.
What happened last week/early this week?
Though it happened for a litany of reasons, in our opinion, the catalyst for the recent selloff was one main culprit: Interest Rates
Higher government spending and less central bank easing are two main factors that have been driving interest rates higher, and the stock market is finally taking notice. Interest rates were the “straw” that finally broke the equity market’s back. Within the global growth story, the part that is spooking markets now is signals that inflation will rise. That could increase the pressure on central banks to hike rates at a quicker pace.
Corporate earnings and key economic data have been coming in strong, however, which gives us reason for optimism. In the end, earnings are the most important driver of equity performance over time.
We will probably see more volatility as 2018 progresses, but as we have seen over the last 4 decades, it is a normal occurrence. In our upcoming communications, among other topics, we will be touching on what to do, if anything, in the face of volatility. In the meantime, if you have any questions for us or if there is anything we can do for you, please let us know.