Escaping a Bear Encounter
“Far more money has been lost by investors trying to anticipate corrections, then lost by corrections themselves.” – Peter Lynch
On July 25th, 2018, Facebook’s stock price closed at $217.50. It closed the following day at $176.26. This precipitous decline marked the largest one-day loss in market capitalization ever, with Facebook moving into bear market territory by losing almost $120 Billion overnight! But then it got worse. The stock preceded to trade all the way down to $124/share on Christmas Eve of that year, losing almost half of its value since its prior all-time high back on July 25th.
Did Mark Zuckerberg wake up Christmas morning in a panic? No, he woke up and went back to work, and Facebook’s stock now trades around $265/share*, or 22% higher than its 2018 high water mark.
In August of that year, we published a short piece on market volatility, which you can find here. We wanted to explore the stock price volatility of what were then and still are 3 of the largest and arguably most important companies in the world…Apple, Amazon, and Microsoft. We went all the way back to 2007, and what we found was that volatility was a predictable and normal occurrence, even for these juggernauts.
Fast forward to 2020. This year has been an incredible lesson of patience in the face of market volatility. Let us use Apple as an example. It closed at an (adjusted) all time high of $81.80 on February 12th. Over the next 3 weeks, it traded down almost 32%, and closed at $56.09 on March 23rd. Investors were so distraught at this time we switched our TV from CNBC to the Tiger King for distraction. And it actually worked! Over the following 5 ½ months, Apple’s stock roared all the way back 140% to $134.18 per share on September 1st. But then, in about 4 trading days, Apple fell 17% to $112.18/share.
This is nothing new for Apple though. The company first went public in December of 1980, and has returned over 100,000% for investors since then. But along the way, it’s dropped more than 75% on three different occasions, and fallen more than 50% several other times**. The volatility has been extreme this year but not unprecedented by any means. We expect it to continue as we work through the Corona Virus crisis, and this year has been a great testament to not panicking during nervous times.
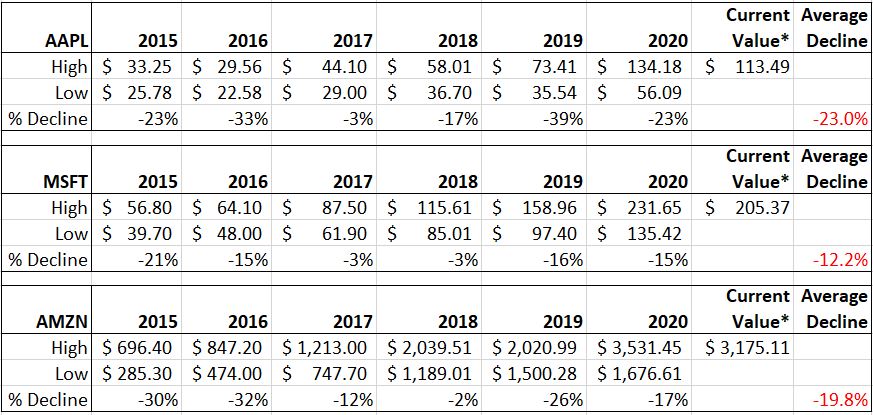
Below is an updated version of our prior chart of Apple, Amazon, and Microsoft, which illustrates their annual high and low share price going back to 2015. It also shows the % share price drop from the prior year’s highest price to the next year’s lowest price. These prices are adjusted for splits.
 Data Derived from ValueLine, YahooFinance.
Based on this data, the average decline (from 2015 to 2020) from the prior year’s high to the next year’s low was -23% for Apple, -12.2% for Microsoft, and -19.8% for Amazon. If we look back all the way to 2007, as we did in our prior email, the average declines fall to -26.07% for Apple, -26.4% for Amazon, and -21.5% for Microsoft. In the midst of all of the volatility, bear markets, and all that has happened over the last 14 years, the share prices of these stocks continue to climb the wall of worry.
As we have always said, given the right asset allocation to mirror one’s investment goals, our behavior over time will be the largest determinant of achieving those goals. This game is not won in days, weeks, months, or even years. It’s won over decades. Even the best companies in the world are not immune to extreme volatility in times like these. But our behavior can be.
As always, please let us know if there is anything we can do for you.
*current value as of the close of business 9.10.2020 **marketwatch.com, Sept. 2020 This material is intended for informational/educational purposes only and should not be construed as investment advice, a solicitation, or a recommendation to buy or sell any security or investment product. Please contact your financial professional for more information specific to your situation.